My Internet Vanished for Three Hours, and All I Got Was This Awesome Monitoring Setup!
After a frustrating three-hour internet outage left me completely blind, I decided enough was enough. Join me as I recount my journey from network darkness to a brightly lit monitoring dashboard, sharing the tools and lessons learned along the way.
Hey fellow homelabbers! Ever had that sinking feeling when your internet just... disappears? No lights on the modem, no ping, just silence? Yeah, that was me last month, staring blankly at my router for what felt like an eternity, but was actually three agonizing hours. My wife was trying to stream, I was trying to work (or procrastinate, let's be honest), and suddenly, nothing.
The worst part? I had no idea what was going on. Was it my ISP? My router? A faulty cable somewhere in the wall? I was completely flying blind, rebooting everything in sight like a madman, hoping that magical 'off and on again' ritual would fix it. The frustration was real, and the lack of insight was infuriating. I felt utterly helpless.
The 'Aha!' Moment: Enough is Enough!
That's when it hit me. This can't happen again. I needed visibility. I needed monitoring. Not just a simple 'is my internet up?' but 'why is my internet down?' and 'what's the performance like when it is up?' My goal was simple: know immediately when something's wrong, and ideally, have some data to point fingers (or fix things) intelligently.
Diving into the Monitoring Rabbit Hole
My first step was research. I knew about tools like Nagios and Zabbix, but I wanted something a bit more modern, flexible, and perhaps, a little more 'homelab-friendly' to integrate with my existing Docker setup. Here’s what I ended up with:
1. Uptime Kuma: The 'Is It Alive?' Watchdog
First stop, simple 'is it alive?' checks. Uptime Kuma became my go-to for external services (like Google DNS, Cloudflare, and even my own public IP) and critical internal ones (my NAS, my Home Assistant instance). It's super easy to set up with Docker, provides a beautiful dashboard, and those push notifications to Telegram or Discord are a lifesaver. Now, I know within seconds if my internet connection actually drops or if a core service goes offline.
2. Prometheus & Grafana: The Data Powerhouses
For deeper metrics, I knew I needed something more robust. Enter Prometheus for data collection and Grafana for visualization. This was a bit more of a learning curve, but oh boy, was it worth it:
• Node Exporter: This gem runs on my Linux servers (my Proxmox host, VMs, and even my Raspberry Pi) and pulls essential metrics like CPU usage, RAM, disk I/O, and network traffic.
• SNMP Exporter: This was key for my Ubiquiti gear (UDM-Pro, switches, access points). Getting the right OIDs (Object Identifiers) to pull specific data points like port traffic, device health, and client counts was a mini-quest, but totally worth the effort. Now I can see exactly how much data each port on my switch is pushing!
• Blackbox Exporter: Crucial for external pings (to my ISP's gateway, Google DNS, etc.) and HTTP checks. This gives me a clear picture of latency and packet loss beyond my local network.
Challenges Along the Way (and How I Overcame Them)
The biggest challenge was definitely figuring out all the different exporters and then building meaningful dashboards in Grafana. My first few dashboards were a chaotic mess of random graphs! Learning PromQL (Prometheus Query Language) was another hurdle; it felt like learning a new language just for metrics, but once it clicked, the power was immense.
I overcame these by:
• Starting Simple: Instead of trying to monitor everything at once, I focused on core metrics first (internet connectivity, server health).
• Leveraging the Community: The homelab and self-hosting communities (Reddit, forums) were invaluable for examples and troubleshooting specific exporter configurations.
• Experimentation: I wasn't afraid to break things (in a test environment, of course!) and try different queries until I got the data I needed.
• Alerting: Setting up alert rules in Grafana was the final piece – now I get a Telegram notification if my internet drops below a certain threshold or if a server's disk usage is too high.
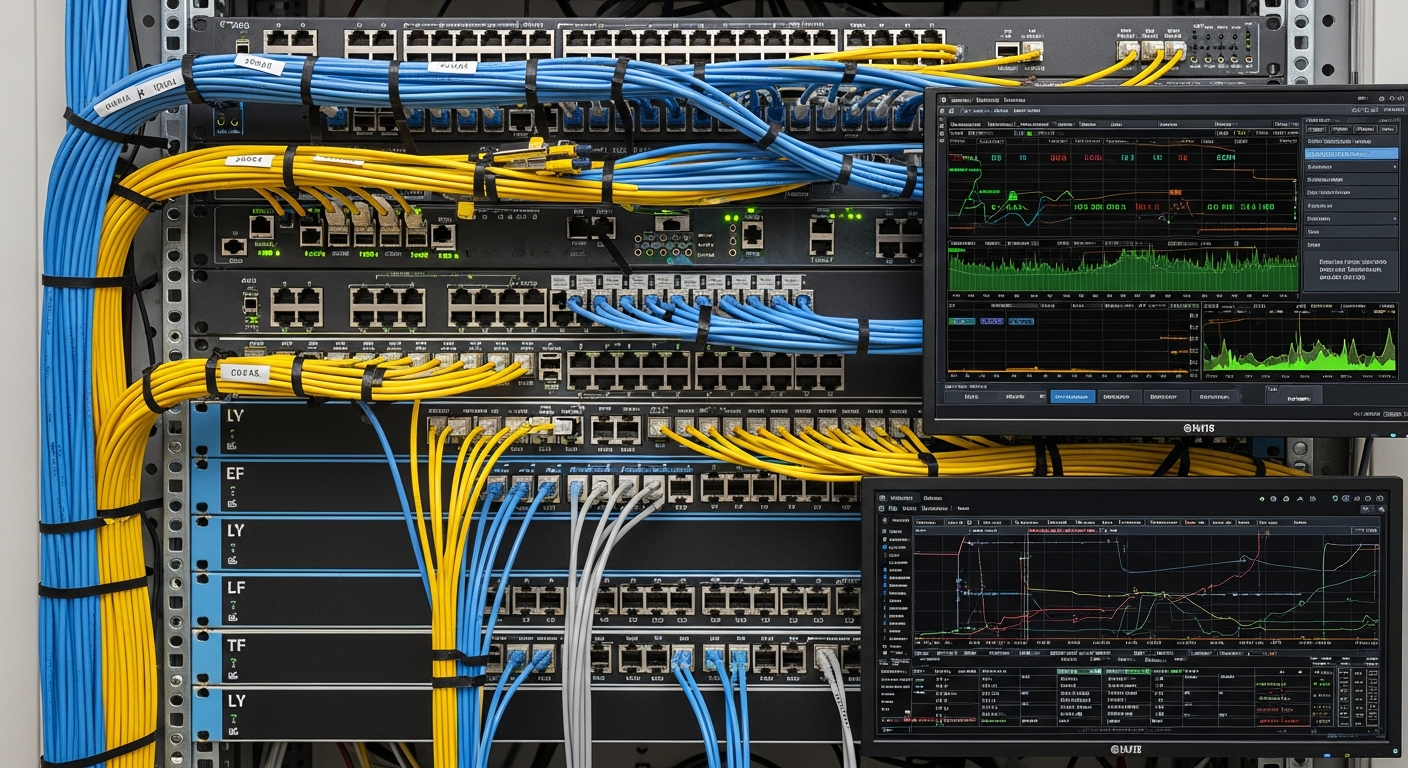
The Sweet Taste of Success: My Monitoring Dashboard
Now, my Grafana dashboard is the command center. I can see my internet's latency over time, individual device uptime, network traffic per port, server health, container resource usage... you name it. That three-hour outage? Now, I'd know within minutes if it's my ISP or something internal, and I'd have historical data to show for it. No more frantic reboots or blind guessing!
What I Learned
• Proactive Monitoring Beats Reactive Troubleshooting: Knowing *before* something catastrophic happens is a game-changer.
• Data is Power: Having historical data helps identify trends, pinpoint root causes, and even justify upgrades or changes.
• Start Simple and Expand: Don't try to monitor everything at once. Build up your monitoring system incrementally.
• The Learning Curve is Rewarding: Tools like Prometheus and Grafana have a steep learning curve, but the knowledge gained is incredibly valuable for any tech enthusiast.
If you're running a homelab, or just rely heavily on your internet (which, let's face it, is most of us!), please, please set up some monitoring. That one frustrating outage was the kick I needed, and I haven't looked back. It's given me peace of mind and a deeper understanding of my home network than I ever thought possible. Happy monitoring!